Real-time Context Demo
Introduction
Systems like Apache Kafka allow organisations to develop event driven architectures, which allow businesses to react to changes in real time. While these systems provide a flexible way to implement new business processes on top of low latency data streams, it can often be difficult to analyse the state of those streams and get a clear picture of the data as it exists now.
Typically, companies will load the streams from Kafka topics into an analytical database, like Google Big Table or a datalake based on Open Table Formats like Apache Iceberg, and query the data from there. Alternatively, if it is a common query, they might create specific extract-transform-load (ETL) jobs using Kafka client libraries in bespoke microservices or create a dedicated stream processing job using systems like Apache Flink.
This process can be quite involved and requires time to implement and tune. A simpler alternative can be to create materialized versions of key data streams using Kafka Streams tables and exposing their state stores. This allows the current state of the streams to be queried by various tools, including AI agents.
Agents (be they based on large language models or humans writing queries) work best with the most up-to-date context. Using the latest materialized state of data streams composed of key business events, provides a way to get the most relevant up-to-date data to agents so they can answer queries as accurately as possible.
This walk-through describes an example business use case for materialized streams and how these can be configured to be accessible by an AI agent to answer queries about the current state of the business.
SmartShip
The use case in the walk-through is based on the fictional company SmartShip, which is a logistics and fulfilment company based in Europe. The company employees 75 drivers, operating 50 vehicles, out of 5 warehouse spread across several countries in Europe. They deliver over 10,000 products to 200 customers.
SmartShip has implemented an event driven architecture. All the vehicles report their locations back to head office at least every minute, the warehouses are fully instrumented and each shipment’s status is updated in real-time. Customers issue orders, which contain one or more shipments, via the order management system.
flowchart LR
    subgraph customers["Customers"]
        C1[200 Business
Customers]
        OMS[Order Management
System]
    end

    subgraph warehouses["Warehouses"]
        W1[5 European
Warehouses]
        WMS[Warehouse
Management
System]
        SCAN[Barcode Scanners
& IoT Sensors]
    end

    subgraph fleet["Fleet"]
        V1[50 Vehicles]
        GPS[GPS & Telemetry]
        DRV[75 Drivers]
    end

    PG[(PostgreSQL
Reference Data)]

    subgraph kafka["Apache Kafka"]
        T1[order.status]
        T2[shipment.events]
        T3[vehicle.telemetry]
        T4[warehouse.ops]
    end

    C1 --> OMS
    OMS --> T1

    W1 --> SCAN
    SCAN --> WMS
    WMS --> T2
    WMS --> T4

    V1 --> GPS
    DRV --> V1
    GPS --> T3

    PG <-.-> OMS
    PG <-.-> WMS
There are 4 key Kafka topics in the system:
- order.status: Every time the status of a customer order changes, a
message is posted to this topic containing the customer, order and
shipment IDs and the new status of the order:
RECEIVEDVALIDATEDALLOCATEDSHIPPEDDELIVEREDCANCELLEDRETURNEDPARTIAL_FAILURE- The state of an order only changes once all the shipments within it have moved to the new state.
- shipment.events: This is similar to the order status topic but for
the individual shipments (packages) which make up an order. Messages on
this topic include the customer and shipment IDs, source and destination
information and the status of the shipment:
CREATEDPICKEDPACKEDDISPATCHEDIN_TRANSITOUT_FOR_DELIVERYDELIVEREDEXCEPTIONCANCELLED
- vehicle.telemetry: Each vehicle updates head office at least once a
minute. They provide location, speed and heading information as well as
the current vehicle status:
IDLEEN_ROUTELOADINGUNLOADINGMAINTENANCE
- warehouse.ops: Each warehouse is instrumented to report operations
on shipments. The messages in this topic include the warehouse location,
product and shipment IDs and the type of operation being performed which
include:
RECEIVINGPUTAWAYPICKPACKLOADINVENTORY_ADJUSTMENTCYCLE_COUNT
Each topic has an associated Avro message schema (you can see these
in the schemas module in the demo repository) and these are
registered in an Apicurio
Registry instance.
Real-time State
The data in these four topics represents the current state of the SmartShip business. Downstream of these topics, many different business processes can be attached. For critical business operations the shipment and order events will be persisted in a relational database. However, the people in charge of SmartShip know that this data has more to offer than just facilitating the day-to-day operation of the company. For example the vehicle telemetry could be loaded into a timeseries database for visualisation and routing analytics. The orders and shipment events could be loaded into Apache Iceberg tables to allow for analysis of customer purchasing trends. However, those analytical requirements mean running additional databases and datalake systems, their associated infrastructure and the tooling to extract and load the events into them. What if we would like to see the state of the streams with less infrastructure and crucially less latency?
One option for this is using Kafka Streams and its Interactive Queries functionality. This allows users to write relatively simple Kafka Streams queries that materialize a stream of data as a table-like structure. This table can then be exposed via a server and the value of specific keys, or ranges of keys, queried in real time.
Kafka Streams Materialized Views
Kafka Streams provides a powerful abstraction called a KTable, which represents a changelog stream as a table. Each record in the underlying stream represents an update to the table, and the KTable maintains the latest value for each key. When combined with state stores, KTables become queryable materialized views of your streaming data.
For example, to answer the question “How many shipments are currently
in each of the possible shipment states?”, SmartShip can create a KTable
that reads the shipment.events topic and counts shipments
grouped by their ShipmentEventType:
KTable<String, Long> shipmentCountsByStatus = shipmentStream
    .groupBy(
        (key, value) -> value.getEventType().toString(),
        Grouped.with(Serdes.String(), shipmentEventSerde)
    )
    .count(
        Materialized.<String, Long, KeyValueStore<Bytes, byte[]>>as("active-shipments-by-status")
            .withKeySerde(Serdes.String())
            .withValueSerde(Serdes.Long())
    );
This code:
- Reads from the
shipment.eventsstream - Re-keys each event by its status (e.g.,
IN_TRANSIT,DELIVERED) - Counts the events per key
- Materializes the result into a named state store
The state store is automatically updated as new events arrive, providing a real-time count of shipments in each status that can be queried at any time. For more complex queries, aggregations can build custom objects. For instance, to track per-customer shipment statistics, an aggregate function can maintain a running total of shipments, deliveries, and exceptions for each customer.
Kafka Streams Interactive Queries
Once data is materialized into state stores, Kafka Streams’ Interactive Queries feature allows these stores to be queried directly without needing to export the data to an external database. This provides low query latency on the current state of your streams.
However, Interactive Queries introduce a complication when using a
Kafka Streams deployment which has been scaled out (multiple running
instances of the Kafka Streams application). Kafka Streams distributes
the partitions of the application’s input topic(s) across multiple
application instances, which means any given key’s state might reside on
a different instance than the one receiving the query. If you have three
streams-processor instances, querying for VEH-001’s current
state requires knowing which instance holds that vehicle’s
partition.
Kafka Streams provides functionality to help developers solve this
issue. Each instance of a streams application can set a
application.server configuration values which specifies a
host:port address for that instance. Kafka Streams
applications can then call methods like metadataForAllStreamsClients
on the KafkaStreams instance to receive a StreamsMetadata
object for each application instance. This allows an overall view of the
state store and partition distribution across the application. For a
more direct query, applications can call queryMetadataForKey
to receive specific information on where a given key is located.
While this functionality allows a streams application to locate which instance a given key is on, that is only part of the story. You still need to be able to route queries to the appropriate store. For individual keys this is relatively straight forward, you can query any application instance for the key’s location and once found issue the request to that instance. However, you often need to query a range of keys and so you need to implement a system that can handle aggregating the various look-up requests.
So to provide a production ready Kafka Streams based interactive query system, you need to provide application side RPC endpoints for discovering metadata and serving key and/or key range requests. You then also need somewhere to host the logic for discovering, querying and aggregating the data from the distributed state stores. This logic could be in a library used by the querying entity or could be hosted in a central service which querying entities then call.
Implementing the Interactive Queries
In this project we have opted for providing a centralised query services which handles the distributed query logic and provides a single REST API for querying the Kafka Streams instances. There are two key parts of this architecture:
flowchart LR
    Client
    QA[Query API]

    subgraph SP0[streams-processor-0]
        IQS0[Interactive Query Server]
        KS0[Kafka Streams]
        SS0[(State Store)]
        K0[VEH-001...VEH-016]
        IQS0 --> KS0 --> SS0
    end

    subgraph SP1[streams-processor-1]
        IQS1[Interactive Query Server]
        KS1[Kafka Streams]
        SS1[(State Store)]
        K1[VEH-017...VEH-033]
        IQS1 --> KS1 --> SS1
    end

    subgraph SP2[streams-processor-2]
        IQS2[Interactive Query Server]
        KS2[Kafka Streams]
        SS2[(State Store)]
        K2[VEH-034...VEH-050]
        IQS2 --> KS2 --> SS2
    end

    Client --> QA
    QA --> IQS0
    QA --> IQS1
    QA --> IQS2
Streams Processor (Interactive Query Server):
streams-processor/src/main/java/com/smartship/streams/InteractiveQueryServer.javaEach instance of the Stream Processor application hosts an instance of our custom Interactive Query Server which implements endpoints for each of the state stores. They also each provide a metadata endpoint which the Query Gateway can use to discover key locations:
/metadata/instances/{storeName}- Lists all instances hosting a store/metadata/instance-for-key/{storeName}/{key}- Finds the specific instance for a key
Query API (Gateway):
query-api/src/main/java/com/smartship/api/KafkaStreamsQueryService.javaA stateless Quarkus-based service that:
- Discovers all streams-processor instances via Kubernetes headless service DNS
- Health-checks each instance to build a list of available nodes
- Routes key-specific queries to the correct instance using metadata lookups
- Aggregates results across all instances for queries that span multiple partitions
This architecture allows the Query API to provide a unified interface to clients while the streams-processor instances scale horizontally, each managing its portion of the partitioned state.
An example query
To show the process end-to-end, let’s walk through how the system answers the question: “How many shipments are currently in each status?”
This query requires aggregating data from multiple partitions that may be distributed across different streams-processor instances, making it a good example of how the interactive query architecture handles distributed state.
Step 1: Creating the Materialized View (KTable)
The LogisticsTopology class creates a materialized view
by consuming the shipment.events topic and counting
shipments by their status:
KTable<String, Long> shipmentCountsByStatus = shipmentStream
    .groupBy(
        (_, value) -> value.getEventType().toString(),
        Grouped.with(Serdes.String(), shipmentEventSerde)
    )
    .count(
        Materialized.<String, Long, KeyValueStore<Bytes, byte[]>>as("active-shipments-by-status")
            .withKeySerde(Serdes.String())
            .withValueSerde(Serdes.Long())
    );
This code:
- Re-keys each shipment event by its status (e.g.,
IN_TRANSIT,DELIVERED,EXCEPTION) - Groups all events with the same status key together
- Counts the number of events per status
- Materializes the result into a named state store called
active-shipments-by-status
As new shipment events arrive, the counts are automatically updated in real-time. The keys for this store will be distributed between the instances of the Kafka Streams application.
Step 2: Interactive Query Server Endpoints
Each streams-processor instance runs an
InteractiveQueryServer that exposes HTTP endpoints for
querying its local state store partition. This includes an endpoint for
returning the current state of the
active-shipments-by-status store:
server.createContext("/state/active-shipments-by-status", this::handleActiveShipmentsByStatus);private void handleActiveShipmentsByStatus(HttpExchange exchange) throws IOException {
...
ReadOnlyKeyValueStore<String, Long> store = streams.store(
StoreQueryParameters.fromNameAndType(
"active-shipments-by-status",
QueryableStoreTypes.keyValueStore()
)
);
// Query all statuses from this instance's partition
Map<String, Long> counts = new LinkedHashMap<>();
for (ShipmentEventType status : ShipmentEventType.values()) {
Long count = store.get(status.name());
counts.put(status.name(), count != null ? count : 0L);
}
sendJsonResponse(exchange, counts);
...
}The server also provides metadata endpoints that the Query API uses to discover the location of particular keys:
GET /metadata/instances/{storeName}- Returns all instances hosting partitions of a storeGET /metadata/instance-for-key/{storeName}/{key}- Finds which instance holds a specific key
Step 3: Query API Gateway Aggregation
The Query API acts as a gateway that coordinates queries across all
streams-processor instances. First, it discovers healthy instances via
DNS (see query-api/src/main/java/com/smartship/api/services/StreamsInstanceDiscoveryService.java):
// Resolve all IPs for the headless Kubernetes service
InetAddress[] addresses = InetAddress.getAllByName(headlessService);

for (InetAddress address : addresses) {
    String instanceUrl = UriBuilder.newInstance()
        .scheme("http")
        .host(address.getHostAddress())
        .port(port)
        .build()
        .toString();

    if (isInstanceHealthy(instanceUrl)) {
        healthyInstances.add(instanceUrl);
    }
}
Then it queries all instances in parallel and merges the results (see
getAllStatusCounts in query-api/src/main/java/com/smartship/api/KafkaStreamsQueryService.java):
// Create parallel futures to query each instance
List<CompletableFuture<Map<String, Long>>> futures = instances.stream()
    .map(instance -> CompletableFuture.supplyAsync(
        () -> queryJsonNumberMap(instance, "/state/active-shipments-by-status"),
        executorService
    ))
    .collect(Collectors.toList());

// Wait for all queries to complete
CompletableFuture.allOf(futures.toArray(new CompletableFuture[0])).join();

// Merge counts from all instances (sum values for each status)
Map<String, Long> mergedCounts = new HashMap<>();
for (CompletableFuture<Map<String, Long>> future : futures) {
    Map<String, Long> instanceCounts = future.get();
    instanceCounts.forEach((status, count) ->
        mergedCounts.merge(status, count, Long::sum)
    );
}
Query Flow Diagram
The following diagram illustrates the complete flow when a client requests shipment counts by status:
sequenceDiagram
    participant Client
    participant QueryAPI as Query API Gateway
    participant DNS as Kubernetes DNS
    participant SP0 as streams-processor-0
    participant SP1 as streams-processor-1
    participant SP2 as streams-processor-2

    Client->>QueryAPI: GET /api/shipments/status/all

    Note over QueryAPI: Discover healthy instances
    QueryAPI->>DNS: Resolve streams-processor-headless
    DNS-->>QueryAPI: [10.0.0.1, 10.0.0.2, 10.0.0.3]

    par Health checks
        QueryAPI->>SP0: GET /health
        SP0-->>QueryAPI: {"status": "UP"}
        QueryAPI->>SP1: GET /health
        SP1-->>QueryAPI: {"status": "UP"}
        QueryAPI->>SP2: GET /health
        SP2-->>QueryAPI: {"status": "UP"}
    end

    Note over QueryAPI: Query all instances in parallel
    par Parallel state store queries
        QueryAPI->>SP0: GET /state/active-shipments-by-status
        SP0-->>QueryAPI: {"IN_TRANSIT": 150, "DELIVERED": 89}
        QueryAPI->>SP1: GET /state/active-shipments-by-status
        SP1-->>QueryAPI: {"IN_TRANSIT": 142, "DELIVERED": 95}
        QueryAPI->>SP2: GET /state/active-shipments-by-status
        SP2-->>QueryAPI: {"IN_TRANSIT": 138, "DELIVERED": 91}
    end

    Note over QueryAPI: Merge results by summing counts
    QueryAPI-->>Client: {"IN_TRANSIT": 430, "DELIVERED": 275, ...}
The key point to understand here is that because the state store is partitioned by key across instances, no single instance has the complete picture. The Query API (unless it is looking for a single key) has to aggregate results from all the Kafka Streams instances in order to provide an accurate answer. For queries that target a specific key (e.g., “What is the count for IN_TRANSIT?”), the Query API can use the metadata endpoint to route the request directly to the instance holding that key’s partition.
Other queries
The SmartShip streams-processor maintains nine state stores in total, each designed to answer specific business questions:
Shipment Tracking
| State Store | Question Answered |
|---|---|
active-shipments-by-status |
How many shipments are in each status right now? |
shipments-by-customer |
What are the shipment statistics for a specific customer? |
late-shipments |
Which shipments are past their expected delivery time? |
Fleet Management
| State Store | Question Answered |
|---|---|
vehicle-current-state |
Where is a specific vehicle and what is it doing? |
Warehouse Operations
| State Store | Question Answered |
|---|---|
warehouse-realtime-metrics |
What operations have occurred at each warehouse in the last 15 minutes? |
hourly-delivery-performance |
What is the delivery performance for each warehouse over the past hour? |
Order Management
| State Store | Question Answered |
|---|---|
order-current-state |
What is the current status of a specific order? |
orders-by-customer |
What are the order statistics for a specific customer? |
order-sla-tracking |
Which orders are at risk of breaching their SLA? |
Each state store uses an appropriate Kafka Streams pattern:
- Counting stores (like
active-shipments-by-status) use.count()aggregations - Latest-value stores (like
vehicle-current-state) use.reduce()to keep only the most recent event - Aggregating stores (like
shipments-by-customer) use.aggregate()with custom accumulator objects - Windowed stores (like
warehouse-realtime-metrics) use time-based windows to provide metrics over specific time periods
These stores are exposed via the Query API with REST endpoints such as:
GET /api/shipments/status/all- Returns counts for all shipment statusesGET /api/vehicles/state/VEH-001- Returns current state of vehicle VEH-001GET /api/customers/CUST-0001/shipments- Returns shipment stats for customer CUST-0001GET /api/orders/sla-risk- Returns all orders at risk of SLA breach
Hybrid Queries
While streaming state stores are good at providing real-time
aggregations, they don’t contain all the context needed to answer
complex business questions. For example, knowing that
VEH-001 is currently at coordinates (52.5200, 13.4050) is
useful, but an operator also needs to know the driver’s name, the
vehicle’s capacity, and its home warehouse.
The system addresses this by combining Kafka Streams state stores
with PostgreSQL reference data through hybrid queries. The PostgreSQL
database contains relatively static reference data across six tables:
warehouses, customers, vehicles, drivers, products, and routes. The
Query API’s QueryOrchestrationService coordinates queries
across both data sources and merges the results.
For instance, the “enriched vehicle state” hybrid query:
- Fetches the vehicle’s reference data from PostgreSQL (type, capacity, home warehouse)
- Retrieves the vehicle’s real-time telemetry from the Kafka Streams state store (location, speed, status)
- Looks up the assigned driver from PostgreSQL
- Combines all data into a single response with a human-readable summary
{
  "sources": ["postgresql", "kafka-streams"],
  "query_time_ms": 45,
  "data": {
    "vehicle": { "vehicle_id": "VEH-001", "type": "Van", "capacity_kg": 1500 },
    "current_state": { "status": "EN_ROUTE", "speed": 65.5, "location": {...} },
    "driver": { "name": "Jan Kowalski", "license_type": "C" }
  },
  "summary": "Vehicle VEH-001 (Van, 1500kg capacity) is EN_ROUTE at 65.5 km/h, driven by Jan Kowalski"
}
The Query API exposes hybrid queries through endpoints like:
GET /api/hybrid/customers/{id}/overview- Customer details with real-time order and shipment statsGET /api/hybrid/vehicles/{id}/enriched- Vehicle reference data with current telemetryGET /api/hybrid/warehouses/{id}/status- Warehouse details with real-time operational metricsGET /api/hybrid/orders/{id}/details- Order information with customer and shipment context
AI Agent Integration
Now that we have an API for querying the real-time state of SmartShip’s operations, we can integrate this with an AI agent to answer natural language questions about the state of the business.
To achieve this, we need to connect a large language model (LLM) to our Query API so it can fetch the relevant data on demand. There are many different ways we could implement this integration. However, the two we will focus on in this demonstration are:
- Using LangChain4j to build an internal chatbot that employees can use to ask questions about logistics operations via an internally hosted LLM and interface. This chatbot will use tool/function calling to invoke specific API endpoints to get real-time data as needed, with all the data and inference occurring within the company’s infrastructure.
- Using Model Context Protocol (MCP) to expose the same capabilities to external AI agents via a standard interface. This allows SmartShip data engineers to easily create agentic pipelines with externally hosted LLMs and could also allow customers to connect their own AI assistants (e.g., Claude Desktop) to SmartShip’s data via MCP tool calls, with the LLM processing happening on the customer’s side.
Multiple AI Interfaces
Having two access patterns is powerful, however it could lead to code
duplication. To address this, we extracted the business logic for
querying the state stores via an LLM into a shared
ToolOperationsService. This service becomes the single
source of truth for all tool operations, regardless of which AI
interface is calling them.
flowchart TB
    subgraph service["ToolOperationsService"]
        direction LR
        methods["18 business logic methods"]
        normalize["ID normalization"]
        timeout["Timeout & limit management"]
        errors["Consistent error handling"]
    end

    service --> lc4j
    service --> mcp

    subgraph lc4j["LangChain4j Tools"]
        direction TB
        lc4j_ann["@Tool annotation"]
        lc4j_ret["Returns JSON strings"]
        lc4j_cls["6 tool classes"]
    end

    subgraph mcp["MCP Tools"]
        direction TB
        mcp_ann["@Singleton"]
        mcp_ret["Direct object returns"]
        mcp_cls["6 tool classes"]
    end

    lc4j --> dtos
    mcp --> dtos

    subgraph dtos["Shared DTOs"]
        direction LR
        dto1["ShipmentStatusResult"]
        dto2["VehicleStateResult"]
        dto3["CustomerShipmentStatsResult"]
        dto4["ToolError"]
        dto5["...16 result types"]
    end
The ToolOperationsService (see query-api/src/main/java/com/smartship/api/services/ToolOperationsService.java)
handles:
- ID Normalization: LLMs often pass IDs in
inconsistent formats. The service normalizes
"1","0001", or"CUST-0001"to the canonical"CUST-0001"format. - Data Coordination: Orchestrates calls to
KafkaStreamsQueryService,PostgresQueryService, orQueryOrchestrationServiceas needed. - Error Handling: Provides consistent error propagation regardless of caller.
The tool classes become thin wrappers that delegate to this shared service:
// LangChain4j Tool - converts result to JSON string for LLM
@Tool("Get the count of shipments for each status...")
public String getShipmentStatusCounts() {
    ShipmentStatusResult result = operations.getShipmentStatusCounts();
    return objectMapper.writeValueAsString(result);
}

// MCP Tool - returns result directly (framework handles serialization)
@Tool(name = "shipment_status_counts", description = "...")
public Object getShipmentStatusCounts() {
    return operations.getShipmentStatusCounts();
}
Both LLM interface approaches call the same
operations.getShipmentStatusCounts() method, ensuring
identical behavior. The only difference is how the result is returned to
the caller.
Shared Result Types
To ensure consistent data structures across interfaces, we defined
shared DTOs as Java records in
query-api/src/main/java/com/smartship/api/model/tools/.
These records include factory methods for common patterns:
public record ShipmentStatusResult(
    Map<String, Long> statusCounts,
    long totalShipments,
    String message
) {
    public static ShipmentStatusResult of(Map<String, Long> statusCounts) {
        long total = statusCounts.values().stream().mapToLong(Long::longValue).sum();
        return new ShipmentStatusResult(statusCounts, total, null);
    }

    public static ShipmentStatusResult empty() {
        return new ShipmentStatusResult(Map.of(), 0,
            "No shipment data available yet.");
    }
}
This pattern makes it straightforward to add new AI interfaces in the
future - simply create new wrapper classes that delegate to
ToolOperationsService and adapt the response format as
needed.
Internal Chatbot
For the internally hosted chatbot we need a way to ingest and issue queries to the LLM, provide standard system prompts and allow the LLM to invoke specific functions or tools that correspond to our API endpoints.
Using LangChain4j with Quarkus
For the internal chatbot implementation, we use LangChain4j, a Java library that provides a unified interface for working with large language models. The Quarkus framework, which we are already using for the query-api service, has excellent support for LangChain4j through its LangChain4j extension, which provides CDI integration and simplified configuration.
Tool/Function Calling
The key mechanism that allows an LLM to query our real-time data is tool calling (also known as function calling). Instead of trying to embed all the data into the context, we define a set of tools in the system context, that the LLM can invoke to fetch specific information on demand.
When a user asks a question like “How many shipments are currently in transit?”, the LLM:
- Analyzes the question and determines it needs shipment status data
- Invokes the appropriate tool (e.g.,
getShipmentStatusCounts) - Receives the JSON response from the tool
- Synthesizes a natural language answer based on the data
This approach has several advantages:
- The LLM only fetches data it actually needs
- Responses include the most current data from our state stores
- Complex queries can involve multiple tool calls
- The context window isn’t consumed by unnecessary data
Defining the AI Service Interface
LangChain4j uses an interface-based approach where you define a
service contract and the framework generates the implementation. In our
project, the LogisticsAssistant interface (see query-api/src/main/java/com/smartship/api/ai/LogisticsAssistant.java)
serves as the entry point:
@RegisterAiService(
    tools = {
        ShipmentTools.class,
        CustomerTools.class,
        WarehouseTools.class,
        VehicleTools.class,
        PerformanceTools.class,
        ReferenceDataTools.class
    },
    chatMemoryProviderSupplier = SessionChatMemoryProvider.class
)
public interface LogisticsAssistant {

    @SystemMessage("""
        You are SmartShip's Logistics Assistant for a European logistics company.

        You have access to real-time operational data through various tools...

        Always use the available tools to fetch current data before answering.
        Be concise and format numbers clearly.
        """)
    String chat(@MemoryId String sessionId, @UserMessage String userMessage);
}
The @RegisterAiService annotation tells LangChain4j
to:
- Create a runtime implementation of this interface
- Register the specified tool classes for function calling
- Use the
SessionChatMemoryProviderto maintain conversation history per session
The @SystemMessage provides context to the LLM about its
role and capabilities.
Implementing Tools
Each tool class contains methods, annotated with @Tool,
that the LLM can invoke. Here’s an example from
ShipmentTools (see query-api/src/main/java/com/smartship/api/ai/tools/ShipmentTools.java):
@ApplicationScoped
public class ShipmentTools {

    @Inject
    KafkaStreamsQueryService streamsQueryService;

    @Inject
    ObjectMapper objectMapper;

    @Tool("Get the current count of shipments in each status. " +
          "Returns counts for CREATED, PICKED, PACKED, DISPATCHED, IN_TRANSIT, " +
          "OUT_FOR_DELIVERY, DELIVERED, EXCEPTION, and CANCELLED statuses.")
    public String getShipmentStatusCounts() {
        LOG.debug("Tool called: getShipmentStatusCounts");

        try {
            Map<String, Long> statusCounts = streamsQueryService.getAllStatusCounts();

            if (statusCounts == null || statusCounts.isEmpty()) {
                return "{\"message\": \"No shipment status data available\"}";
            }

            long total = statusCounts.values().stream()
                .mapToLong(Long::longValue).sum();

            Map<String, Object> result = new LinkedHashMap<>();
            result.put("status_counts", statusCounts);
            result.put("total_shipments", total);

            return objectMapper.writeValueAsString(result);

        } catch (Exception e) {
            LOG.errorf(e, "Error getting shipment status counts");
            return "{\"error\": \"Failed to retrieve shipment status counts\"}";
        }
    }

    @Tool("Get shipment statistics for a specific customer. " +
          "Customer IDs should be in format CUST-XXXX (e.g., CUST-0001).")
    public String getCustomerShipmentStats(String customerId) {
        // Normalize ID format (e.g., "1" -> "CUST-0001")
        String normalizedId = normalizeCustomerId(customerId);

        try {
            CustomerShipmentStats stats =
                streamsQueryService.getCustomerShipmentStats(normalizedId);

            if (stats == null) {
                return "{\"message\": \"No shipment data found for " + normalizedId + "\"}";
            }

            return objectMapper.writeValueAsString(stats);

        } catch (Exception e) {
            return "{\"error\": \"Failed to retrieve stats: " + e.getMessage() + "\"}";
        }
    }
}
Key patterns in our tool implementations:
- Return JSON strings: Tools return JSON that the LLM can parse and understand
- Descriptive annotations: The
@Tooldescription helps the LLM decide when to use each tool - ID normalization: Handle flexible input formats from users
- Error handling: Return error JSON instead of throwing exceptions
- Inject services: Tools call the existing query services to fetch data
Tool Categories
We organized tools into six categories matching our data domains:
| Tool Class | Methods | Data Source | Purpose |
|---|---|---|---|
| ShipmentTools | 4 | Kafka Streams | Shipment counts, late shipments, customer stats |
| CustomerTools | 3 | PostgreSQL + Hybrid | Customer search, overview, SLA compliance |
| WarehouseTools | 3 | PostgreSQL + Hybrid | Warehouse list, status, performance metrics |
| VehicleTools | 3 | Kafka Streams + PostgreSQL | Vehicle state, fleet status, utilization |
| OrderTools | 3 | Kafka Streams | Order state, SLA risk, customer order stats |
| ReferenceDataTools | 2 | PostgreSQL | Available drivers, routes by origin |
These tools delegate to a shared ToolOperationsService
which centralizes the business logic and data access patterns.
Session Memory
To support multi-message conversations, we implement a
ChatMemoryProvider (see query-api/src/main/java/com/smartship/api/ai/memory/SessionChatMemoryProvider.java)
that maintains conversation history per session:
@Singleton
public class SessionChatMemoryProvider implements Supplier<ChatMemoryProvider> {

    private static final int MAX_MESSAGES = 20;
    private final Map<Object, ChatMemory> memories = new ConcurrentHashMap<>();

    @Override
    public ChatMemoryProvider get() {
        return memoryId -> memories.computeIfAbsent(memoryId, id ->
            MessageWindowChatMemory.builder()
                .id(id)
                .maxMessages(MAX_MESSAGES)
                .build()
        );
    }

    public void clearSession(Object sessionId) {
        memories.remove(sessionId);
    }
}
This implementation stores conversation history in memory with a 20-message window per session. For a production system, you would likely use a persistent store like Redis.
REST API
The chat endpoint in ChatResource exposes the AI
assistant via HTTP:
@Path("/api/chat")
public class ChatResource {

    @Inject
    LogisticsAssistant assistant;

    @POST
    public Response chat(ChatRequest request) {
        String sessionId = request.getSessionId();
        if (sessionId == null || sessionId.isBlank()) {
            sessionId = UUID.randomUUID().toString();
        }

        try {
            String response = assistant.chat(sessionId, request.getMessage());

            return Response.ok(
                ChatResponse.of(response, sessionId)
                    .withSources(List.of("kafka-streams", "postgresql"))
            ).build();

        } catch (Exception e) {
            return Response.status(Response.Status.INTERNAL_SERVER_ERROR)
                .entity(ChatResponse.of("I encountered an error...", sessionId))
                .build();
        }
    }
}
LLM Provider Configuration
The system supports multiple LLM providers, configured via
application.properties:
# Provider selection (ollama, openai, or anthropic)
quarkus.langchain4j.chat-model.provider=${LLM_PROVIDER:ollama}

# Ollama (default - local/Kubernetes)
quarkus.langchain4j.ollama.base-url=${OLLAMA_BASE_URL:http://ollama.smartship.svc.cluster.local:11434}
quarkus.langchain4j.ollama.chat-model.model-id=llama3.2
quarkus.langchain4j.ollama.chat-model.temperature=0.3

# OpenAI (optional)
quarkus.langchain4j.openai.api-key=${OPENAI_API_KEY:not-configured}
quarkus.langchain4j.openai.chat-model.model-name=gpt-4o-mini

# Anthropic (optional)
quarkus.langchain4j.anthropic.api-key=${ANTHROPIC_API_KEY:not-configured}
quarkus.langchain4j.anthropic.chat-model.model-name=claude-3-haiku-20240307
By default, the system uses Ollama running locally in the Kubernetes cluster. This illustrates how an in-house deployment would work but also keeps everything self-contained for demonstration purposes. For production, you might prefer a more powerful frontier model.
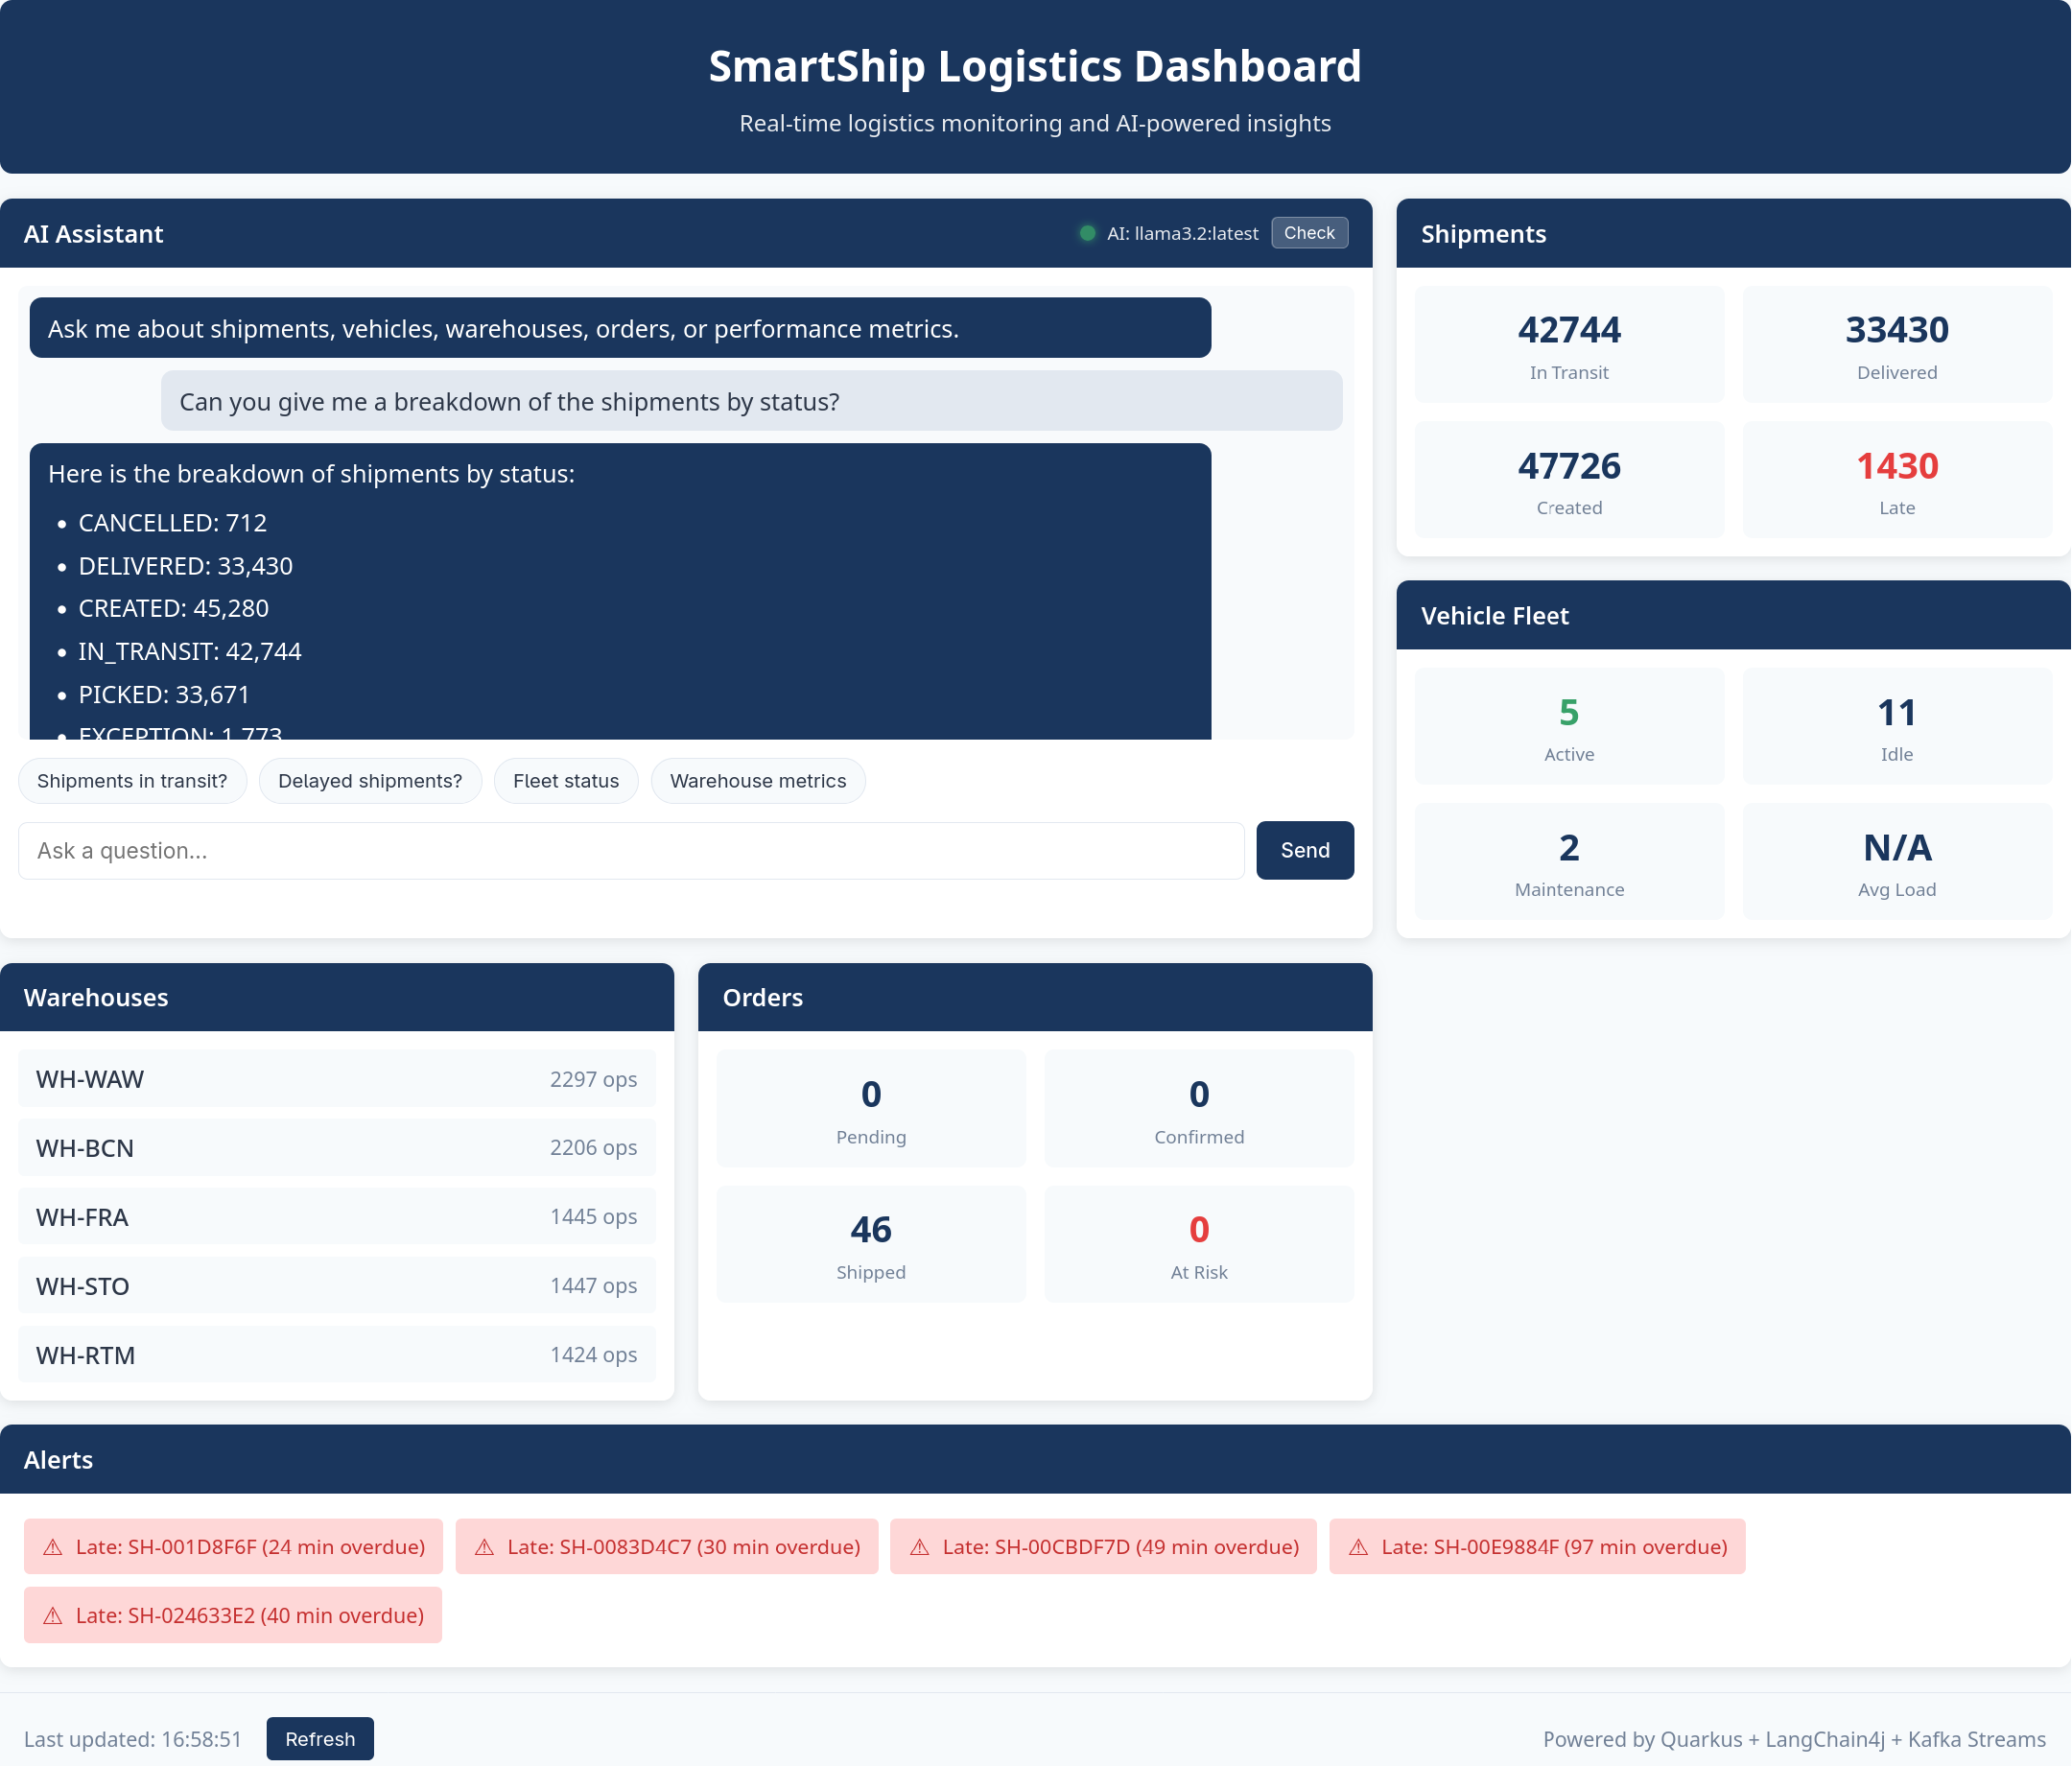
Trying the Chatbot with the Web Dashboard
The Query API includes a built-in web dashboard that provides an easy way to interact with the AI assistant without needing to construct API calls manually.
To access the dashboard:
# Port forward the query-api service
kubectl port-forward svc/query-api 8080:8080 -n smartship &

# Open in browser
xdg-open http://localhost:8080/
The dashboard provides:
- AI Assistant panel: A chat interface where you can type natural language questions about SmartShip operations
- Quick action buttons: Pre-configured queries for common questions like “How many shipments are in transit?” or “Show me delayed shipments”
- Live statistics cards: Real-time counts for shipments, vehicles, warehouses, and orders
- Alerts panel: Displays late shipments and orders at SLA risk
- LLM health indicator: Shows whether the AI assistant is connected and responsive
The chat interface maintains conversation context, so you can ask follow-up questions. For example, after asking about delayed shipments, you can ask “Tell me more about that customer” and the assistant will understand which customer you’re referring to.
The dashboard auto-refreshes statistics every 30 seconds, providing a live view of the streaming data as it flows through the system.
Example Conversation
Here’s an example of how the system handles a multi-turn conversation:
User: “How many shipments are currently in transit?”
The LLM invokes ShipmentTools.getShipmentStatusCounts()
which queries the active-shipments-by-status state store
and returns:
{
  "status_counts": {
    "CREATED": 45,
    "PICKED": 32,
    "PACKED": 28,
    "DISPATCHED": 67,
    "IN_TRANSIT": 127,
    "OUT_FOR_DELIVERY": 43,
    "DELIVERED": 1523,
    "EXCEPTION": 8,
    "CANCELLED": 12
  },
  "total_shipments": 1885
}Assistant: “There are currently 127 shipments in transit. Looking at the overall picture, you have 1,885 total shipments tracked in the system, with 1,523 already delivered and 8 exceptions that may need attention.”
User: “Which shipments are delayed?”
The LLM invokes ShipmentTools.getLateShipments() which
queries the late-shipments state store:
{
  "count": 8,
  "late_shipments": [
    {
      "shipment_id": "SHIP-00234",
      "customer_id": "CUST-0042",
      "expected_delivery": "2024-01-12T14:00:00Z",
      "hours_overdue": 4.5
    },
    ...
  ]
}Assistant: “There are 8 shipments currently delayed. The most overdue is SHIP-00234 for customer CUST-0042, which is 4.5 hours past its expected delivery time…”
User: “Tell me more about that customer”
Using the session context (the LLM remembers CUST-0042 from the
previous response), it invokes
CustomerTools.getCustomerOverview("CUST-0042"):
Assistant: “Customer CUST-0042 is Müller GmbH, a Premium tier customer based in Munich. They have a 94.2% on-time delivery rate across 156 total shipments. Currently they have 12 shipments in transit and 3 pending orders…”
Enabling External AI Agents with MCP
The Problem: Internal-Only Access
The LangChain4j chatbot works well for users accessing SmartShip
through the internal web dashboard, but it has a limitation: the LLM
runs server-side, and the only way to interact with it is through the
/api/chat HTTP endpoint. What about users who want to:
- Use their preferred AI assistant (Claude Desktop, ChatGPT, or a custom agent) to query logistics data?
- Integrate SmartShip data into their own AI-powered applications?
- Automate queries from scripts or monitoring systems?
Building custom integrations for each AI platform would be impractical. We need a standard protocol that any AI agent can use.
The Solution: Model Context Protocol (MCP)
Model Context Protocol (MCP) is an open standard for connecting AI applications to external data sources. Rather than building custom integrations for each AI platform, we implement a single MCP server that any MCP-compatible agent can connect to.
MCP provides a standardized way for AI agents to:
- Discover what tools are available
- Understand what each tool does (via descriptions)
- Invoke tools with structured arguments
- Receive structured results
This is essentially what our LangChain4j tools already do - just with
a different protocol. Because we extracted the business logic into
ToolOperationsService, adding MCP support requires only
creating thin wrapper classes.
Quarkus MCP Server Extension
Implementing the MCP protocol from scratch would require handling:
- JSON-RPC 2.0 message parsing and validation
- Server-Sent Events (SSE) connection management
- Session tracking and message routing
- Tool discovery and schema generation
- Request/response correlation across async streams
The Quarkus MCP Server extension handles all of this infrastructure. As developers, we only need to:
- Add the dependency to
pom.xml - Configure the endpoint in
application.properties - Annotate methods with
@Toolto expose them
The extension automatically: - Generates tool schemas from method
signatures and @ToolArg annotations - Handles JSON
serialization of return values - Manages SSE connections and session
state - Routes incoming requests to the correct tool method - Formats
responses according to the MCP specification
This means our MCP tool classes contain almost no boilerplate - just the business logic delegation:
@Singleton
public class ShipmentMcpTools {

    @Inject
    ToolOperationsService operations;

    @Tool(name = "shipment_status_counts",
          description = "Get the count of shipments for each status. " +
                        "Returns counts for CREATED, PICKED, PACKED, DISPATCHED, " +
                        "IN_TRANSIT, OUT_FOR_DELIVERY, DELIVERED, EXCEPTION, CANCELLED.")
    public Object getShipmentStatusCounts() {
        try {
            return operations.getShipmentStatusCounts();
        } catch (Exception e) {
            return ToolError.of("Failed to retrieve shipment status counts", e);
        }
    }
}
The Quarkus MCP Server extension handles JSON serialization automatically - we just return the result object directly. Compare this to implementing MCP manually, which would require hundreds of lines of protocol handling code.
Configuring the MCP Endpoint
The MCP server is enabled through the main Quarkus configuration:
# application.properties
quarkus.mcp.server.server-info.name=smartship-logistics
quarkus.mcp.server.server-info.version=1.0.0
quarkus.mcp.server.http.root-path=/mcp
This exposes the MCP protocol at /mcp using Streamable
HTTP transport. The server identifies itself as “smartship-logistics” to
connected clients.
Testing the MCP Endpoint
You can test the MCP server directly with curl. The MCP Streamable
HTTP transport requires: 1.
Accept: application/json, text/event-stream header 2.
Session initialization before calling tools 3.
Mcp-Session-Id header for subsequent requests
# Port forward the query-api service
kubectl port-forward svc/query-api 8080:8080 -n smartship &

# Step 1: Initialize session (note the Accept header and -i to capture session ID)
curl -i -X POST http://localhost:8080/mcp \
  -H "Content-Type: application/json" \
  -H "Accept: application/json, text/event-stream" \
  -d '{"jsonrpc": "2.0", "method": "initialize", "params": {"protocolVersion": "2024-11-05", "capabilities": {}, "clientInfo": {"name": "curl", "version": "1.0"}}, "id": 1}'

# Response includes: Mcp-Session-Id: <session-id>
# Use this session ID in subsequent requests

# Step 2: Send initialized notification
curl -X POST http://localhost:8080/mcp \
  -H "Content-Type: application/json" \
  -H "Accept: application/json, text/event-stream" \
  -H "Mcp-Session-Id: <session-id>" \
  -d '{"jsonrpc": "2.0", "method": "notifications/initialized"}'

# Step 3: List available tools
curl -X POST http://localhost:8080/mcp \
  -H "Content-Type: application/json" \
  -H "Accept: application/json, text/event-stream" \
  -H "Mcp-Session-Id: <session-id>" \
  -d '{"jsonrpc": "2.0", "method": "tools/list", "id": 2}' | jq

# Step 4: Call a tool
curl -X POST http://localhost:8080/mcp \
  -H "Content-Type: application/json" \
  -H "Accept: application/json, text/event-stream" \
  -H "Mcp-Session-Id: <session-id>" \
  -d '{
    "jsonrpc": "2.0",
    "method": "tools/call",
    "params": {"name": "shipment_status_counts", "arguments": {}},
    "id": 3
  }' | jq
Connecting Claude Desktop
To connect Claude Desktop to SmartShip’s MCP server, add this to your Claude Desktop configuration:
{
  "mcpServers": {
    "smartship-logistics": {
      "http": "http://localhost:8080/mcp"
    }
  }
}
After connecting, Claude Desktop users can ask natural language questions about SmartShip logistics data, and Claude will automatically invoke the appropriate MCP tools to fetch real-time information.
Available Tools
The MCP server exposes 18 tools matching the LangChain4j tool set:
| Category | Tools |
|---|---|
| Shipments | shipment_status_counts, late_shipments,
shipment_by_status,
customer_shipment_stats |
| Vehicles | vehicle_state, all_vehicle_states,
fleet_utilization |
| Customers | customer_overview,
customer_sla_compliance,
find_customers_by_name |
| Orders | orders_at_sla_risk, order_state,
customer_order_stats |
| Warehouses | warehouse_list, warehouse_status,
warehouse_performance |
| Reference | available_drivers, routes_by_origin |
Because these tools share the same
ToolOperationsService, they return identical data whether
called from the internal chatbot or external AI agents.
Architecture Overview
The diagram below shows the full architecture and how natural language queries flow through the system:
flowchart TB

    Query["'How many shipments are in transit?'"]
    MCPQuery["Claude Code / Other AI Agent"]

    subgraph API["Query API (Quarkus)"]
        direction LR
        Chat["ChatResource
POST /api/chat"]
        MCPEndpoint["MCP Server
POST /mcp"]
        Assistant["LogisticsAssistant
@RegisterAiService"]
        Memory["Session Memory
(20 messages)"]
    end

    subgraph LLM["LLM Provider"]
        Model["Ollama / OpenAI / Anthropic"]
    end

    subgraph Tools["LangChain4j Tools"]
        ST["ShipmentTools"]
        CT["CustomerTools"]
        ToolsEtc["..."]
    end

    subgraph MCPTools["MCP Tools"]
        SMT["ShipmentMcpTools"]
        CMT["CustomerMcpTools"]
        MCPEtc["..."]
    end

    TOS["ToolOperationsService"]

    subgraph Services["Query Services"]
        KS["KafkaStreamsQueryService"]
        PS["PostgresQueryService"]
        QO["QueryOrchestrationService"]
    end

    subgraph Data["Data Stores"]
        Kafka["Kafka Streams
State Stores"]
        PG["PostgreSQL
Reference Data"]
    end

    %% Internal LLM Flow
    Query --> Chat
    Chat --> Assistant
    Assistant <--> Memory
    Assistant <--> Model

    Model <-.->|"tool calls"| ST
    Model <-.->|"tool calls"| CT
    Model <-.->|"tool calls"| ToolsEtc

    %% External MCP Flow
    MCPQuery -->|"MCP JSON-RPC"| MCPEndpoint
    MCPEndpoint --> SMT
    MCPEndpoint --> CMT
    MCPEndpoint --> MCPEtc

    %% Tools to shared service
    ST --> TOS
    CT --> TOS
    ToolsEtc --> TOS
    SMT --> TOS
    CMT --> TOS
    MCPEtc --> TOS

    %% Shared service to query services
    TOS --> KS
    TOS --> PS
    TOS --> QO

    QO --> KS
    QO --> PS

    %% Query services to data stores
    KS --> Kafka
    PS --> PG
The architecture supports two AI integration paths:
- Internal LLM (LangChain4j): Users interact via
/api/chat, the LLM invokes tools, and responses are synthesized in natural language - External AI Agents (MCP): External agents connect
via
/mcp, invoke tools directly, and receive structured JSON responses
This system allows users to ask complex questions about the real-time state of SmartShip’s operations in natural language. Crucially, the LLM is able to provide accurate, up-to-date answers by invoking tools that query the live Kafka Streams state stores and PostgreSQL reference data. The LLM doesn’t need to know the details of how data is stored or queried. It simply invokes tools with descriptive names, receives JSON responses, and uses that data to formulate answers.
Limitations and Considerations
This implementation is a demonstration of what’s possible, not a production-ready solution. There are some limitations, which include:
- In-memory session storage: Conversation history is lost on restart
- No rate limiting: Production systems need throttling
- Single model configuration: No automatic fallback between providers
- No streaming responses: Responses arrive all at once
- MCP authentication: The MCP endpoint has no authentication (relies on network security)
- Tool result size: Large result sets are truncated to prevent context overflow in more modest demo models
For a production deployment, you would also want to consider:
- Guardrails to prevent prompt injection and ensure appropriate responses
- Observability and logging of LLM interactions for debugging and improvement
- Caching of expensive queries to reduce latency
- Fine-tuning or RAG for domain-specific knowledge beyond what tools provide
- MCP endpoint authentication (API keys, OAuth, or mTLS)
- Rate limiting per MCP session to prevent abuse
Despite these limitations, this implementation demonstrates the core concept: connecting an LLM to real-time streaming data through tool calling, enabling natural language queries against the current state of your business operations. It also shows how Kafka Streams and the Quarkus framework make constructing these kind of real-time context setups easy to achieve.